Including cities across North America, Europe, Asia, Africa, South America, and Oceania.
CityLens: Evaluating Large Vision-Language Models for Urban Socioeconomic Sensing
1 Information Hub, The Hong Kong University of Science and Technology (Guangzhou)
2 Department of Electronic Engineering, BNRist, Tsinghua University
3 School of Electronic and Information Engineering, Beijing Jiaotong University
4 Zhongguancun Academy
† Corresponding authors
ICLR 2026Abstract
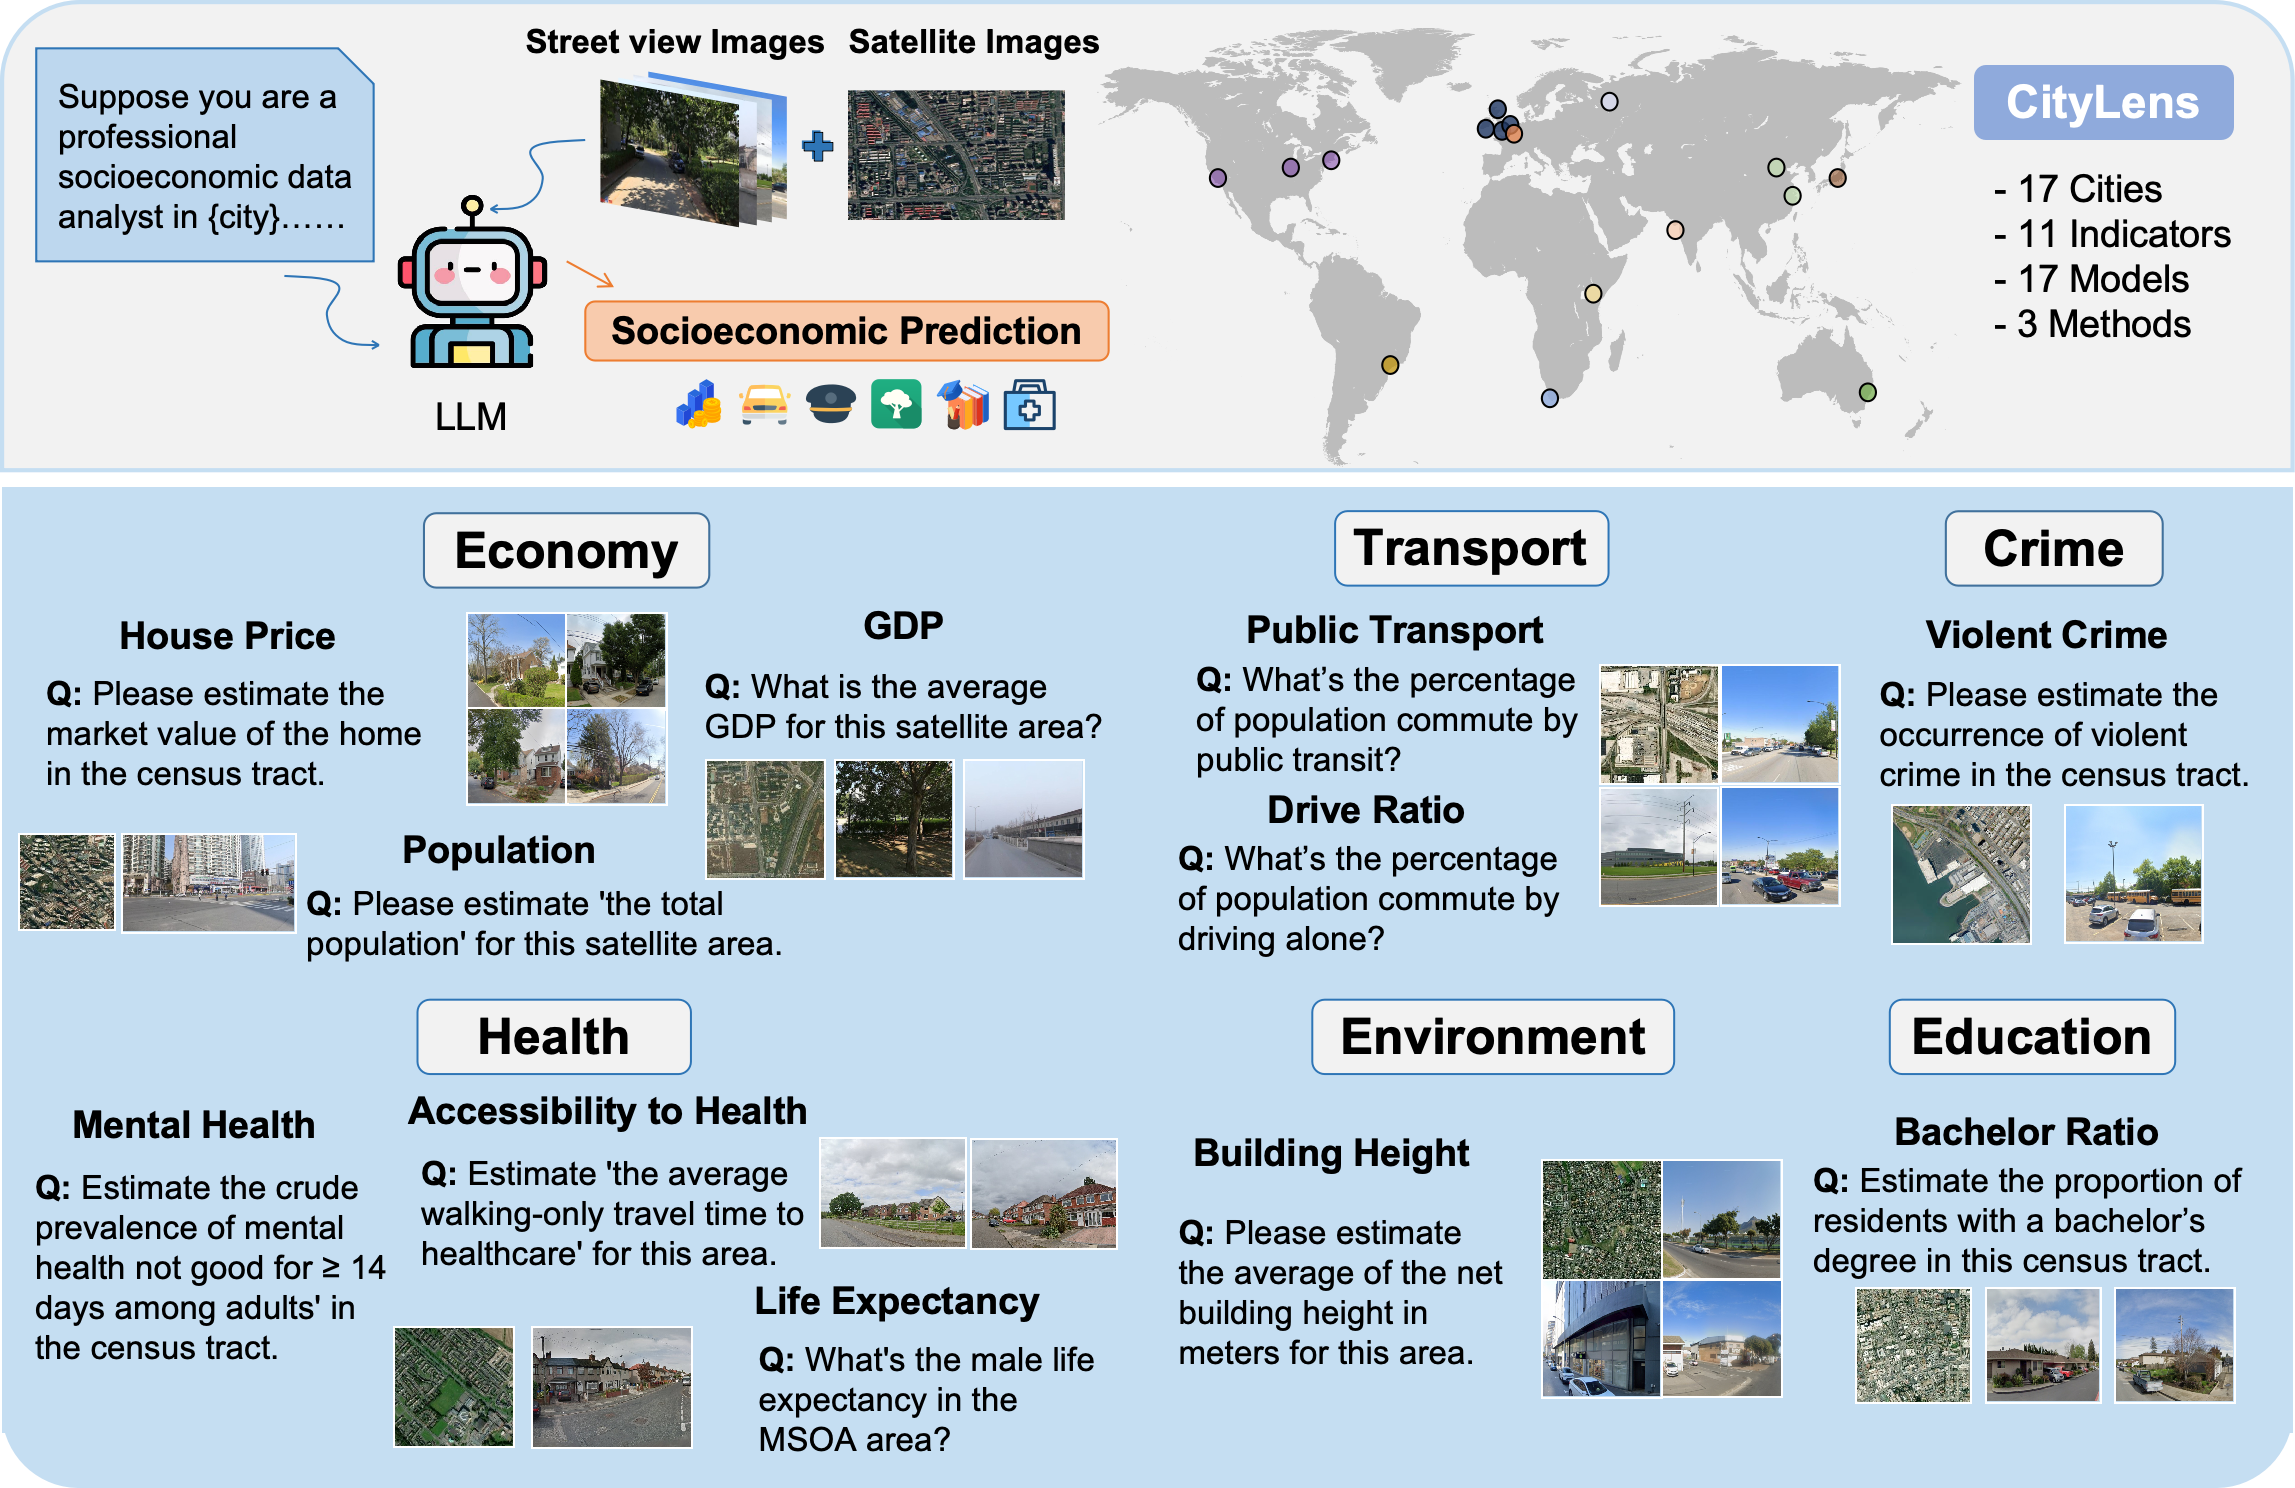
Understanding urban socioeconomic conditions through visual data is a challenging yet essential task for sustainable urban development and policy planning. In this work, we introduce CityLens, a comprehensive benchmark designed to evaluate the capabilities of Large Vision-Language Models in predicting socioeconomic indicators from satellite and street view imagery. We construct a multi-modal dataset covering a total of 17 globally distributed cities, spanning 6 key domains: economy, education, crime, transport, health, and environment, reflecting the multifaceted nature of urban life. Based on this dataset, we define 11 prediction tasks and utilize 3 evaluation paradigms: Direct Metric Prediction, Normalized Metric Estimation, and Feature-Based Regression. We benchmark 17 state-of-the-art LVLMs across these tasks. Together, these characteristics make CityLens the most extensive socioeconomic benchmark to date in terms of geographic coverage, indicator diversity, and model scale. Our results reveal that while LVLMs demonstrate promising perceptual and reasoning capabilities, they still exhibit limitations in predicting urban socioeconomic indicators. CityLens provides a unified framework for diagnosing these limitations and guiding future efforts in using LVLMs to understand and predict urban socioeconomic patterns.
Benchmark
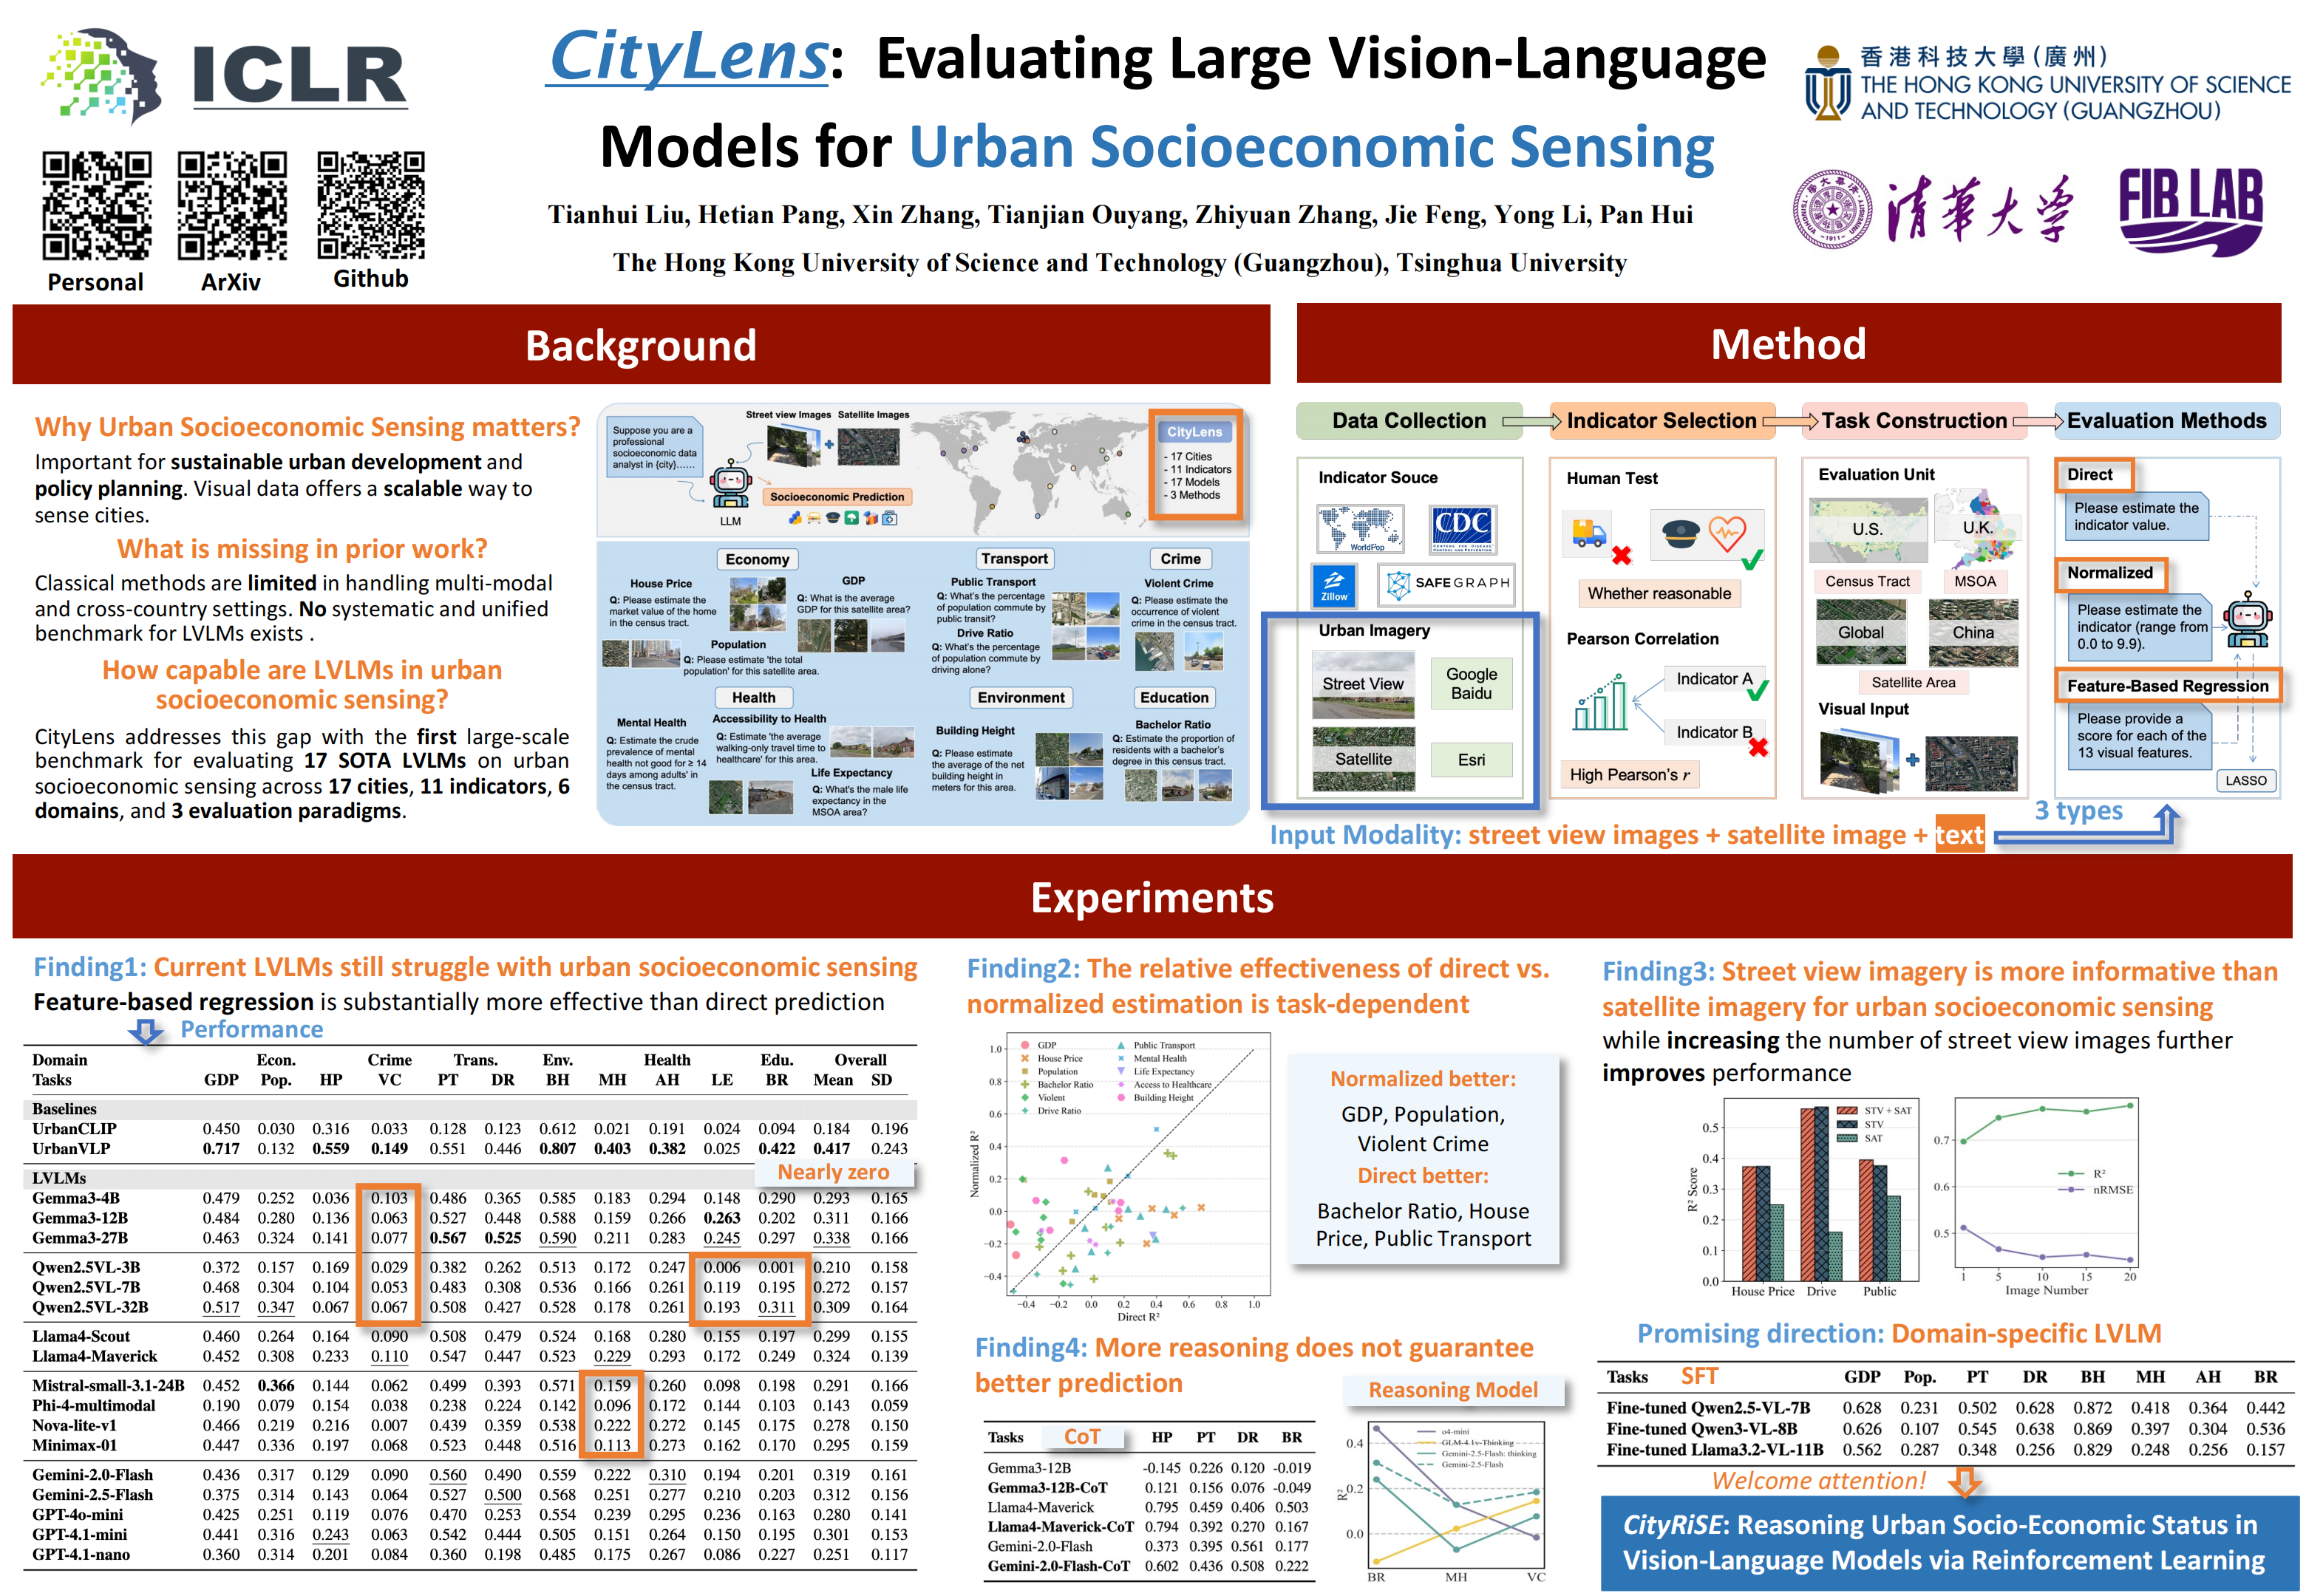
CityLens pairs each evaluation region with one satellite image, ten street view images, and scalar labels for 11 socioeconomic indicators across 17 globally distributed cities. The benchmark spans economy, education, crime, transport, health, and environment, with geographic units aligned to satellite areas, census tracts, or MSOAs.
Economy, education, crime, transport, health, and environment.
GDP, population, house price, public transport, drive ratio, mental health, and more.
Open and proprietary systems are evaluated under the same task definitions.
Dataset construction and task selection
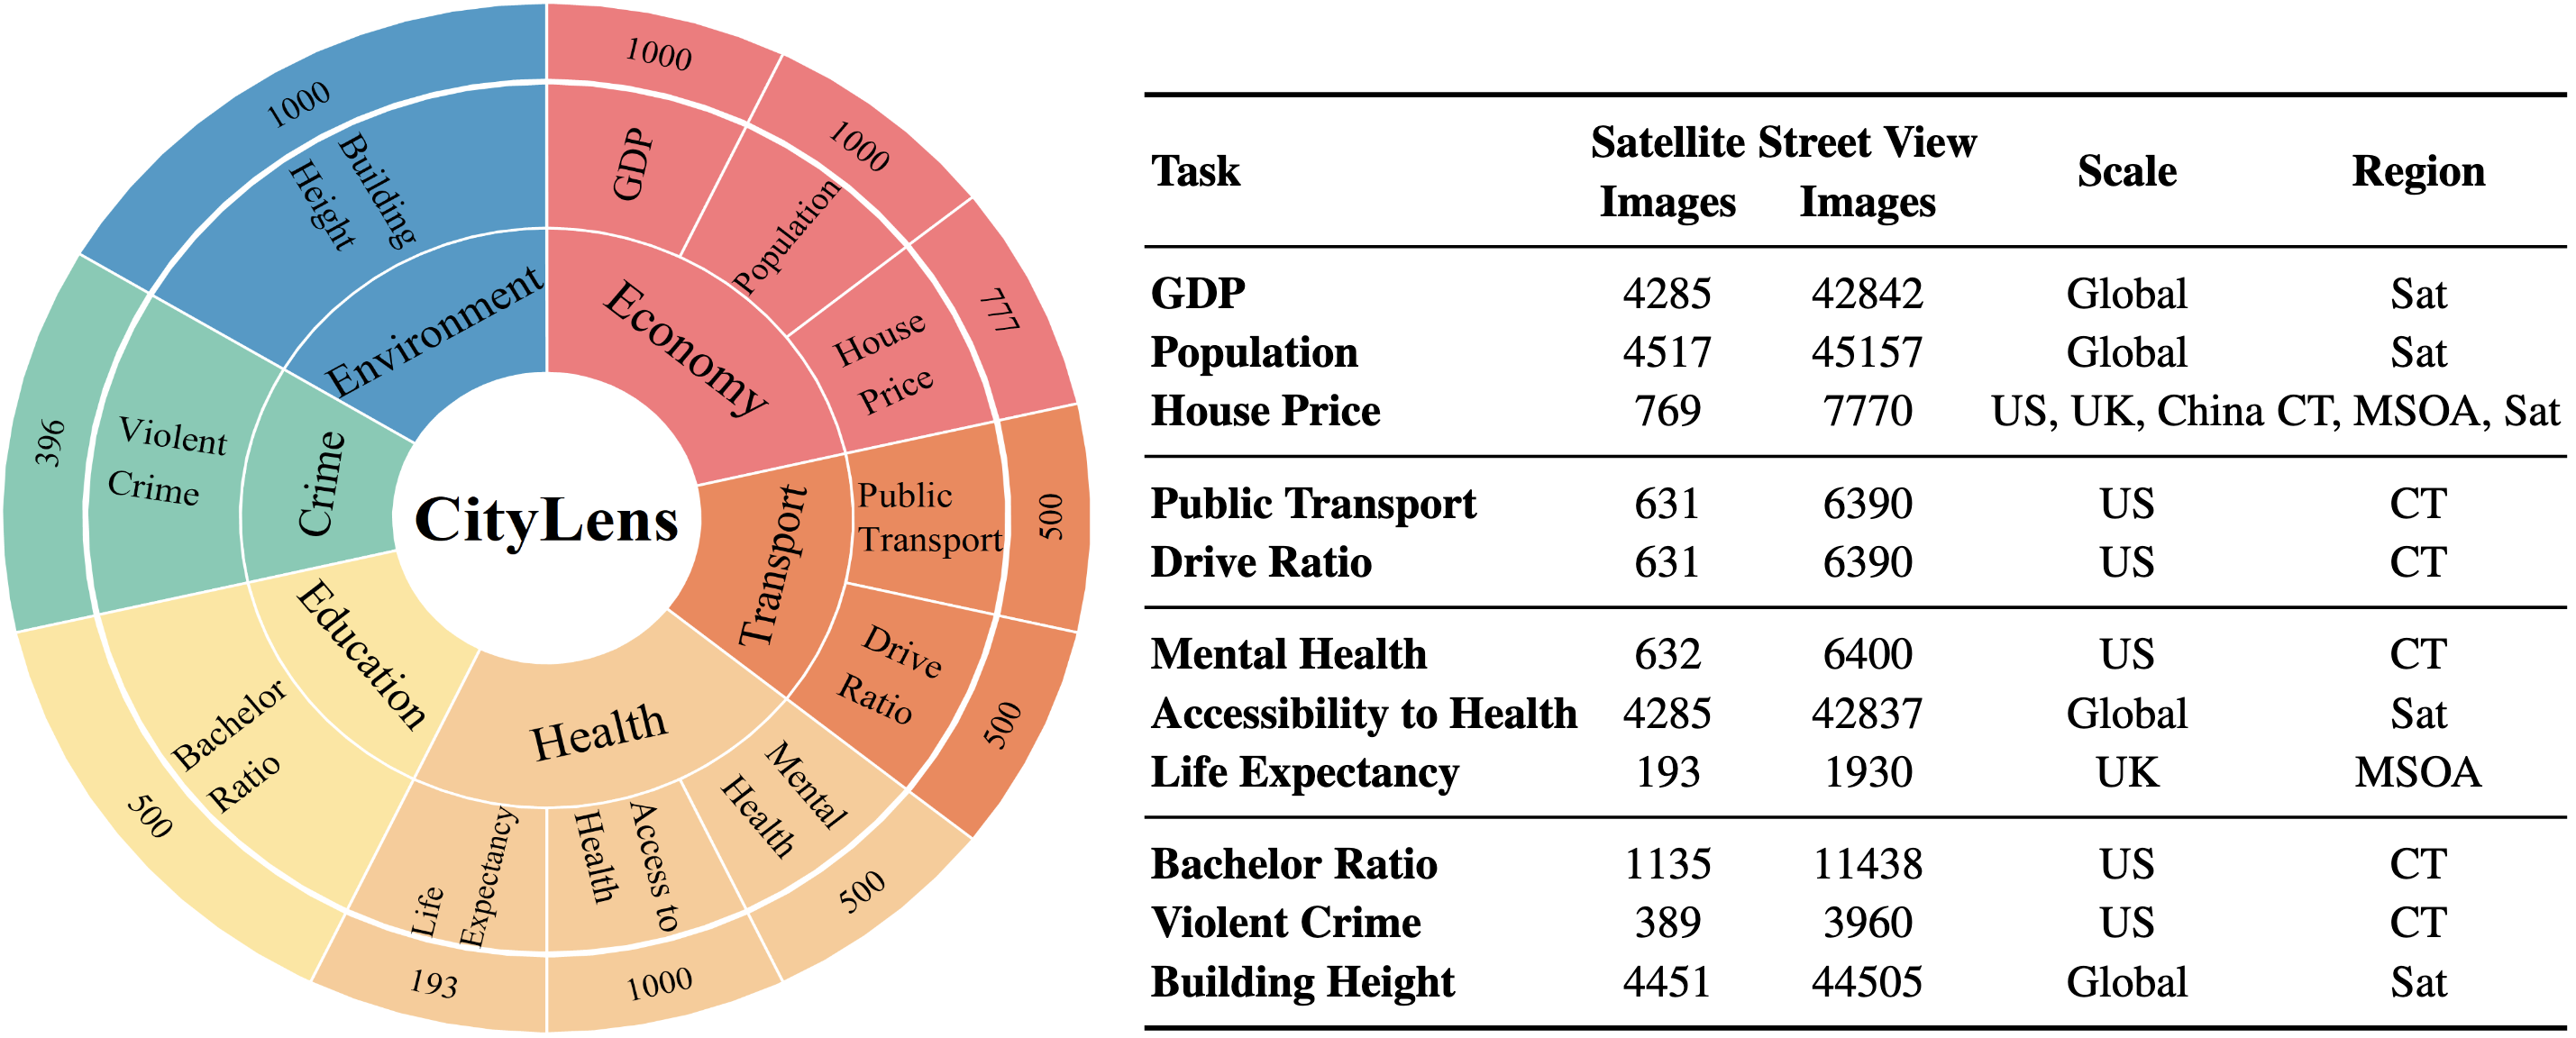
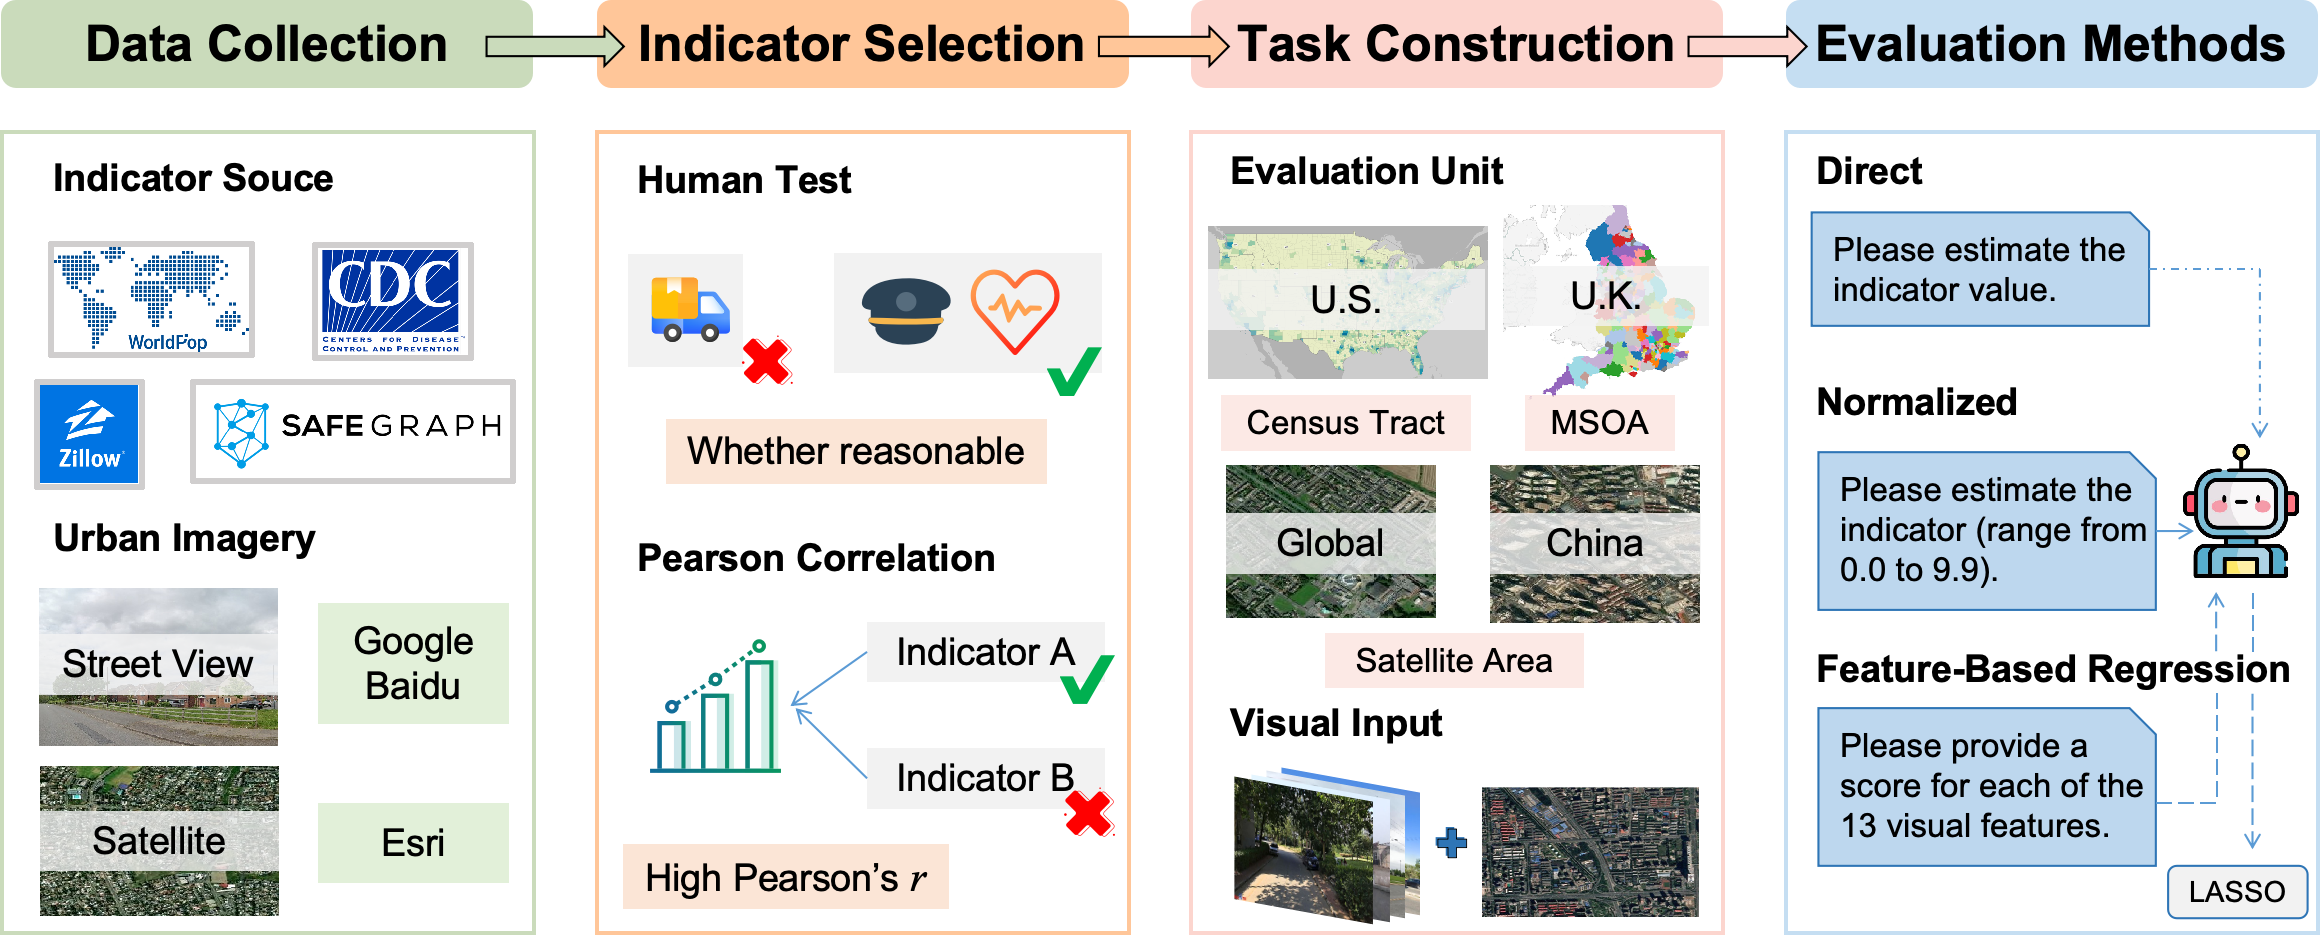
From 28 collected socioeconomic indicators, CityLens selects 11 prediction tasks by checking whether each indicator has plausible visual relevance and by removing redundancy among semantically similar indicators. Each region is paired with one satellite image, ten street view images, and scalar labels mapped from heterogeneous geographic sources.
The final benchmark spans global satellite-area tasks, U.S. census tract tasks, and U.K. MSOA tasks, with up to 500 cases for country-specific indicators and up to 1000 cases for globally available indicators.
Indicators
Eleven prediction tasks across six
urban domains.
GDP
Population
House Price
Public Transport
Drive Ratio
Mental Health
Accessibility to Healthcare
Life Expectancy
Bachelor Ratio
Violent Crime
Building Height
Evaluation Paradigms
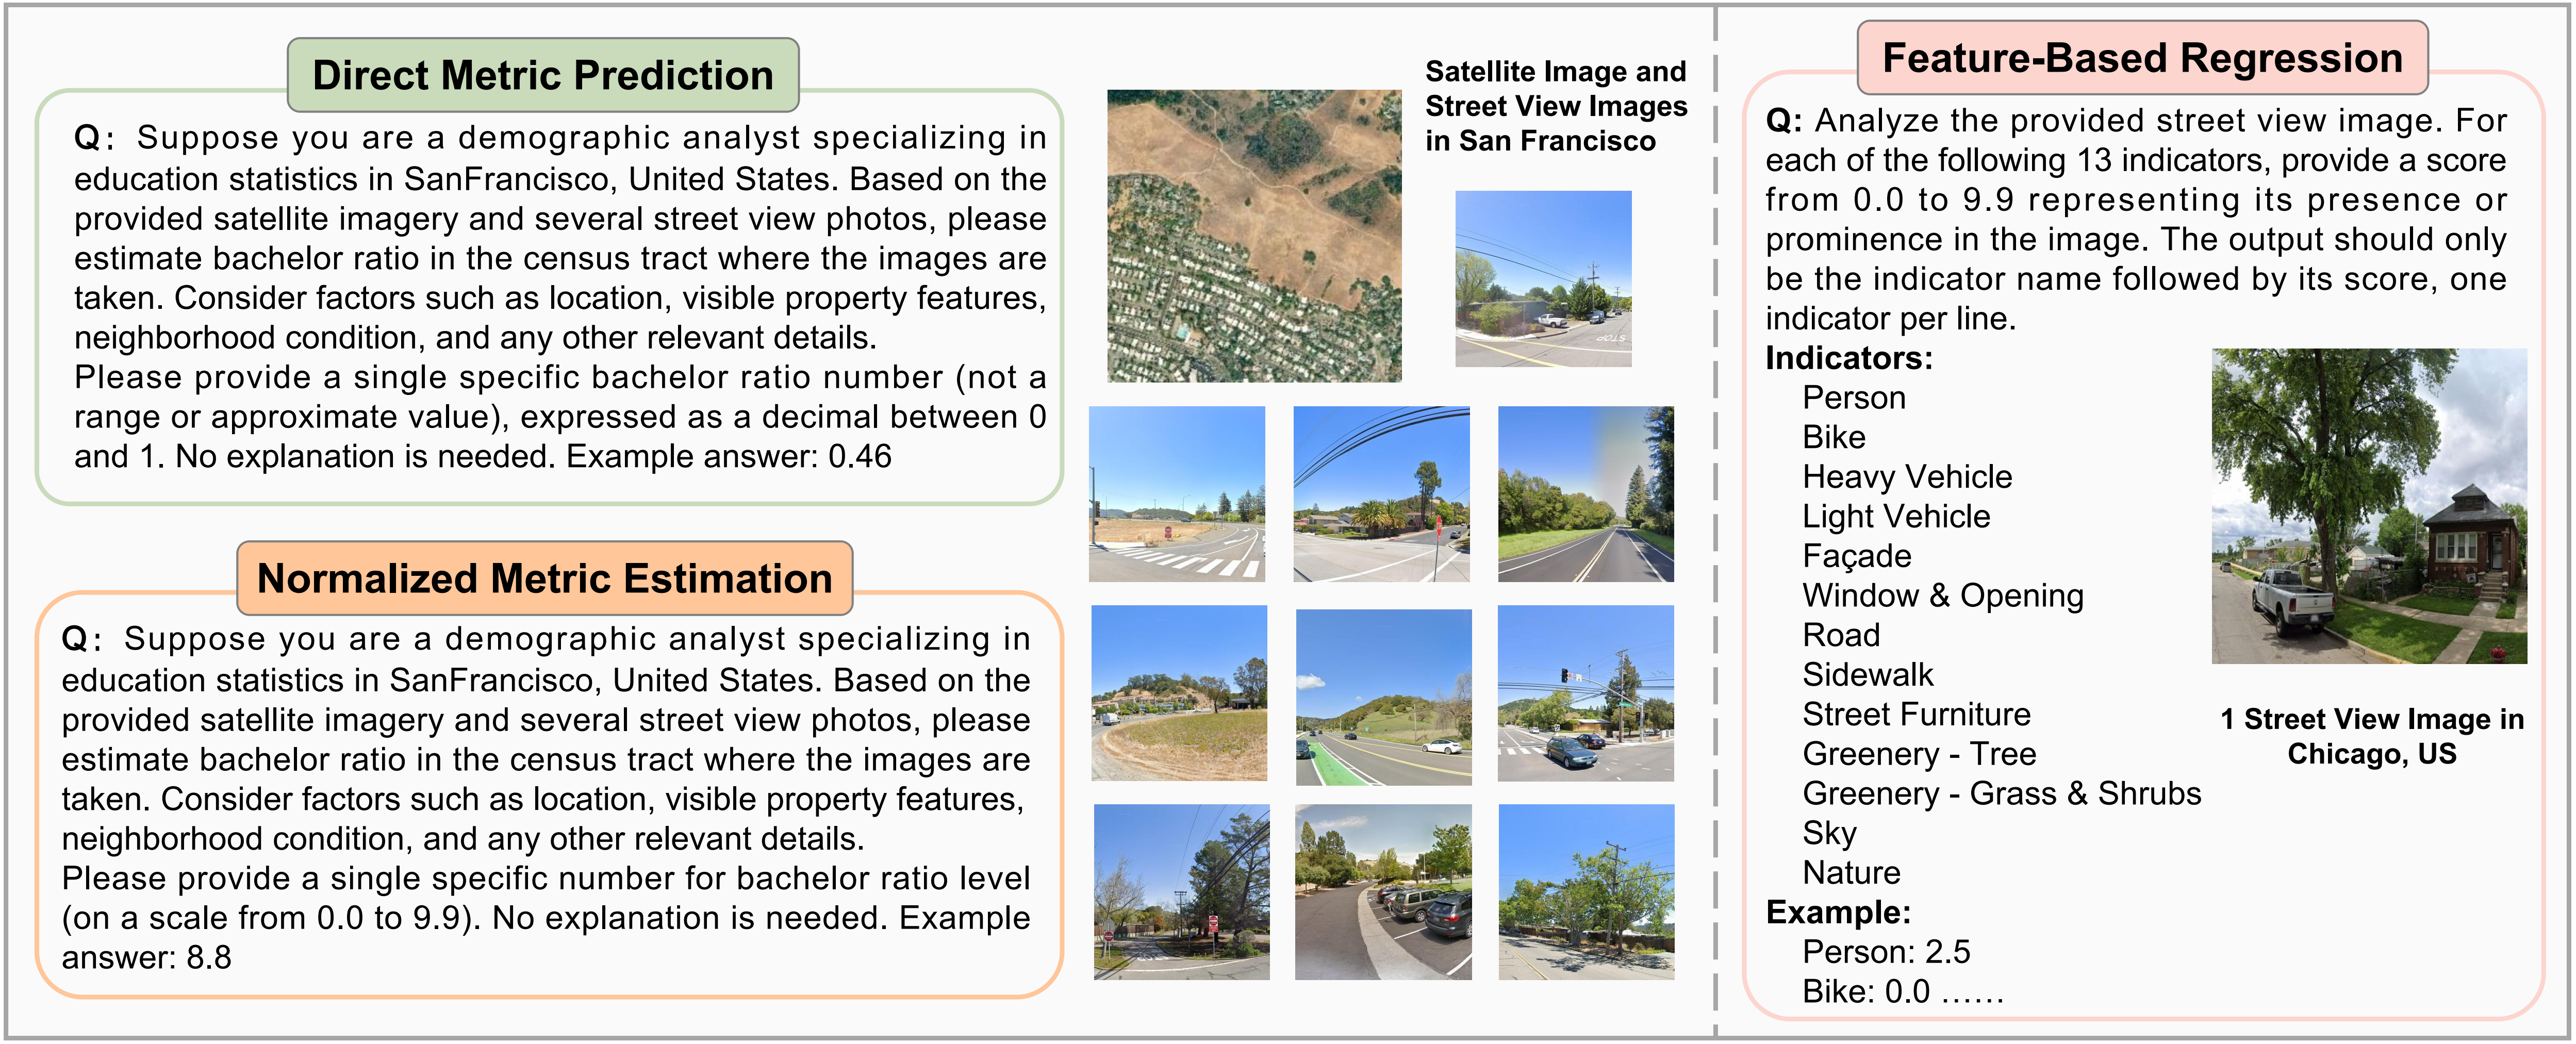
CityLens evaluates direct numeric prediction, normalized score estimation, and feature-based regression so that perceptual grounding, relative ranking, and numeric calibration can be compared under a unified benchmark.
Three ways to evaluate LVLMs
Direct Metric Prediction
The model receives urban imagery and directly outputs a socioeconomic value.
Normalized Metric Estimation
The target is converted to a 0.0-9.9 scale to emphasize relative ranking.
Feature-Based Regression
LVLM-scored visual attributes are mapped to labels with a LASSO regressor.
Results
Put the figures you want to browse into
assets/images/, then add them to assets/figures.js.
Poster
Citation
Tianhui Liu, Hetian Pang, Xin Zhang, Tianjian Ouyang, Zhiyuan Zhang, Jie Feng, Yong Li, and Pan Hui. CityLens: Evaluating Large Vision-Language Models for Urban Socioeconomic Sensing. International Conference on Learning Representations, 2026.
@inproceedings{liu2026citylens,
  title={CityLens: Evaluating Large Vision-Language Models for Urban Socioeconomic Sensing},
  author={Liu, Tianhui and Pang, Hetian and Zhang, Xin and Ouyang, Tianjian and Zhang, Zhiyuan and Feng, Jie and Li, Yong and Hui, Pan},
  booktitle={International Conference on Learning Representations},
  year={2026}
}